The donut effect: How the pandemic hollowed out America’s biggest cities
Major downtowns have lost 8 percent of their population since March 2020.
When my wife and I bought our row house in northwest Washington DC back in 2015, there was a group house next door with an ever-changing cast of 20-something tenants. Then last year, they all moved out. The home now sits empty.
A lot of people left the nation’s capital last year. Recently the Census Bureau announced that Washington DC lost 20,000 people between July 2020 and July 2021, a decline of 2.9 percent. It was a stark reversal for a city that gained 80,000 residents between 2010 and 2020.
Directly across the Potomac from DC are Arlington County and the city of Alexandria. These affluent, densely populated jurisdictions lost 2.5 percent of their population. The next tier of suburban counties—Virginia’s Fairfax and Maryland’s Montgomery and Prince George’s—shrank by 0.8 percent.
But if you zoom out further, to DC’s exurban fringe, the story is different. Maryland’s Calvert, Charles, and Frederick Counties grew by nearly 2 percent. On the Virginia side, seven outlying counties grew by 1.1 percent.
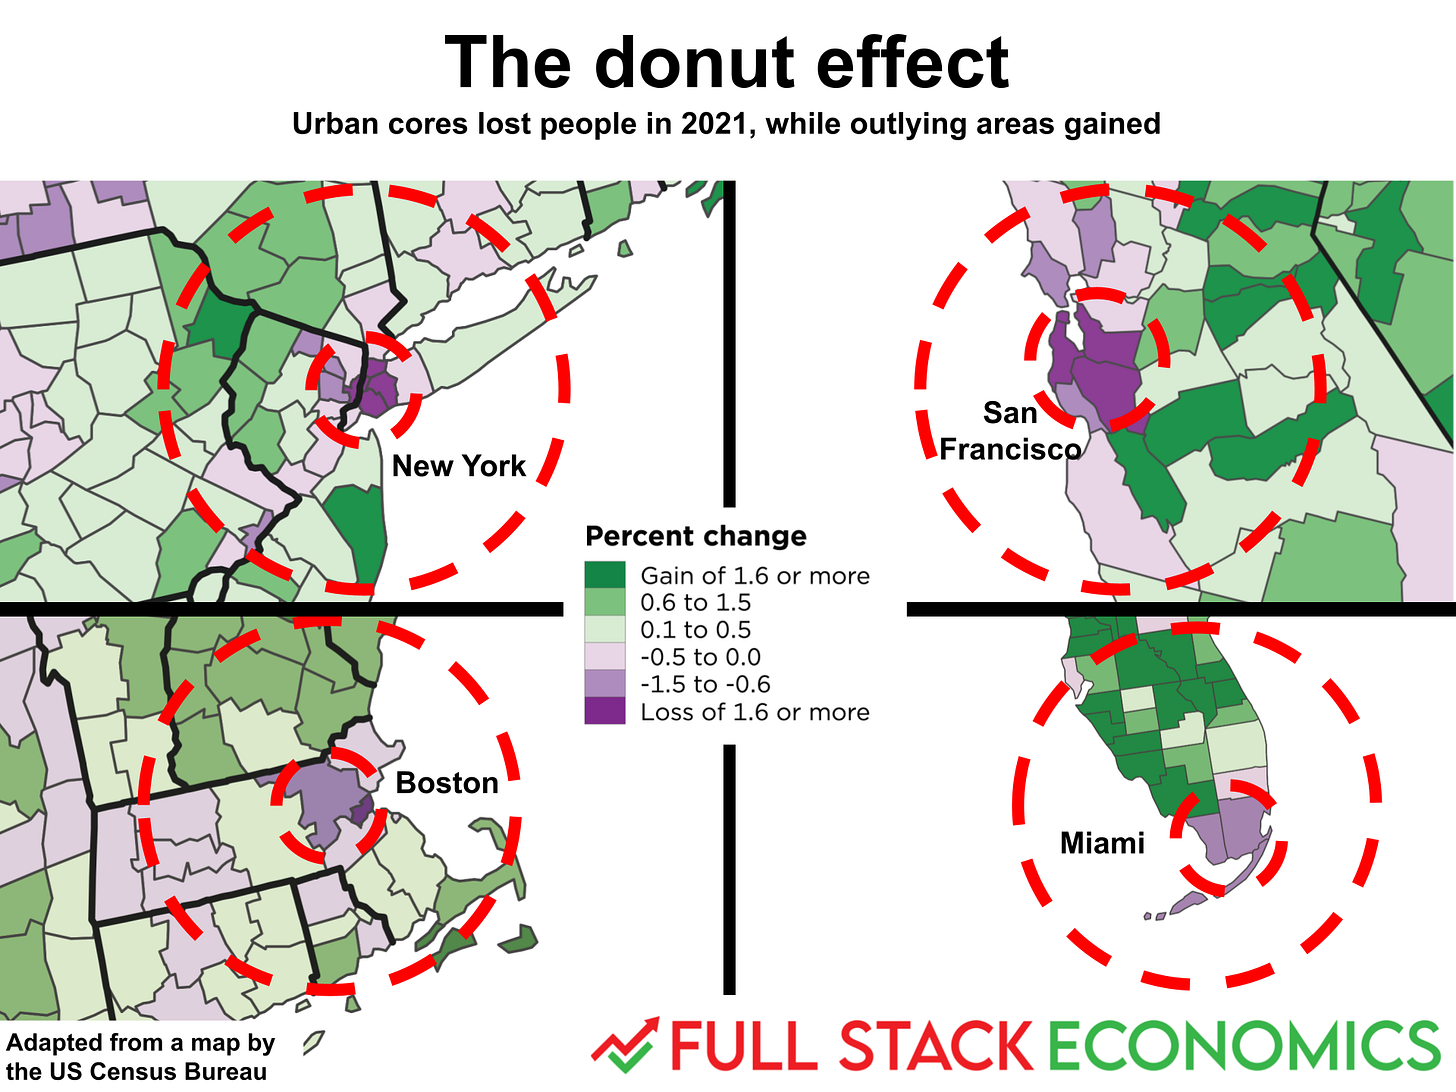
If you put these changes on a map, it kind of looks like a donut:
In a 2021 paper, Stanford scholars Arjun Ramani and Nicholas Bloom coined the phrase “donut effect” to describe how COVID-19 was transforming America’s major metropolitan areas. Before the pandemic, people paid top dollar to live close to the center of the DC metropolitan area. But when COVID hit, people stopped going to the office, bars and restaurants shut down, and the urban lifestyle became a lot less enticing.
Some people responded by fleeing their metropolitan areas altogether. Last year my colleague Alan Cole wrote about the Mountain Lions, nine mid-sized cities whose growth was turbo-charged by the pandemic, as people left Los Angeles and San Francisco for a better standard of living in states like Utah or Idaho.
But others moved further out in their existing metropolitan areas. These people have driven a massive real estate boom on the fringes of major metropolitan areas.
It’s not just Washington DC. The Census Bureau recently published a fascinating high-resolution map showing county-level population growth across the United States. In the graphic above, I’ve zoomed in on four cities that exhibit donut-like development patterns. In each case, the urban core is purple, indicating substantial population loss. But further out there are patches of green indicating healthy growth.
The donut effect by the numbers
You might be skeptical of this analysis. The geographic patterns here are not perfect donut shapes, and you might wonder if I cherry-picked metro areas that best fit the pattern.
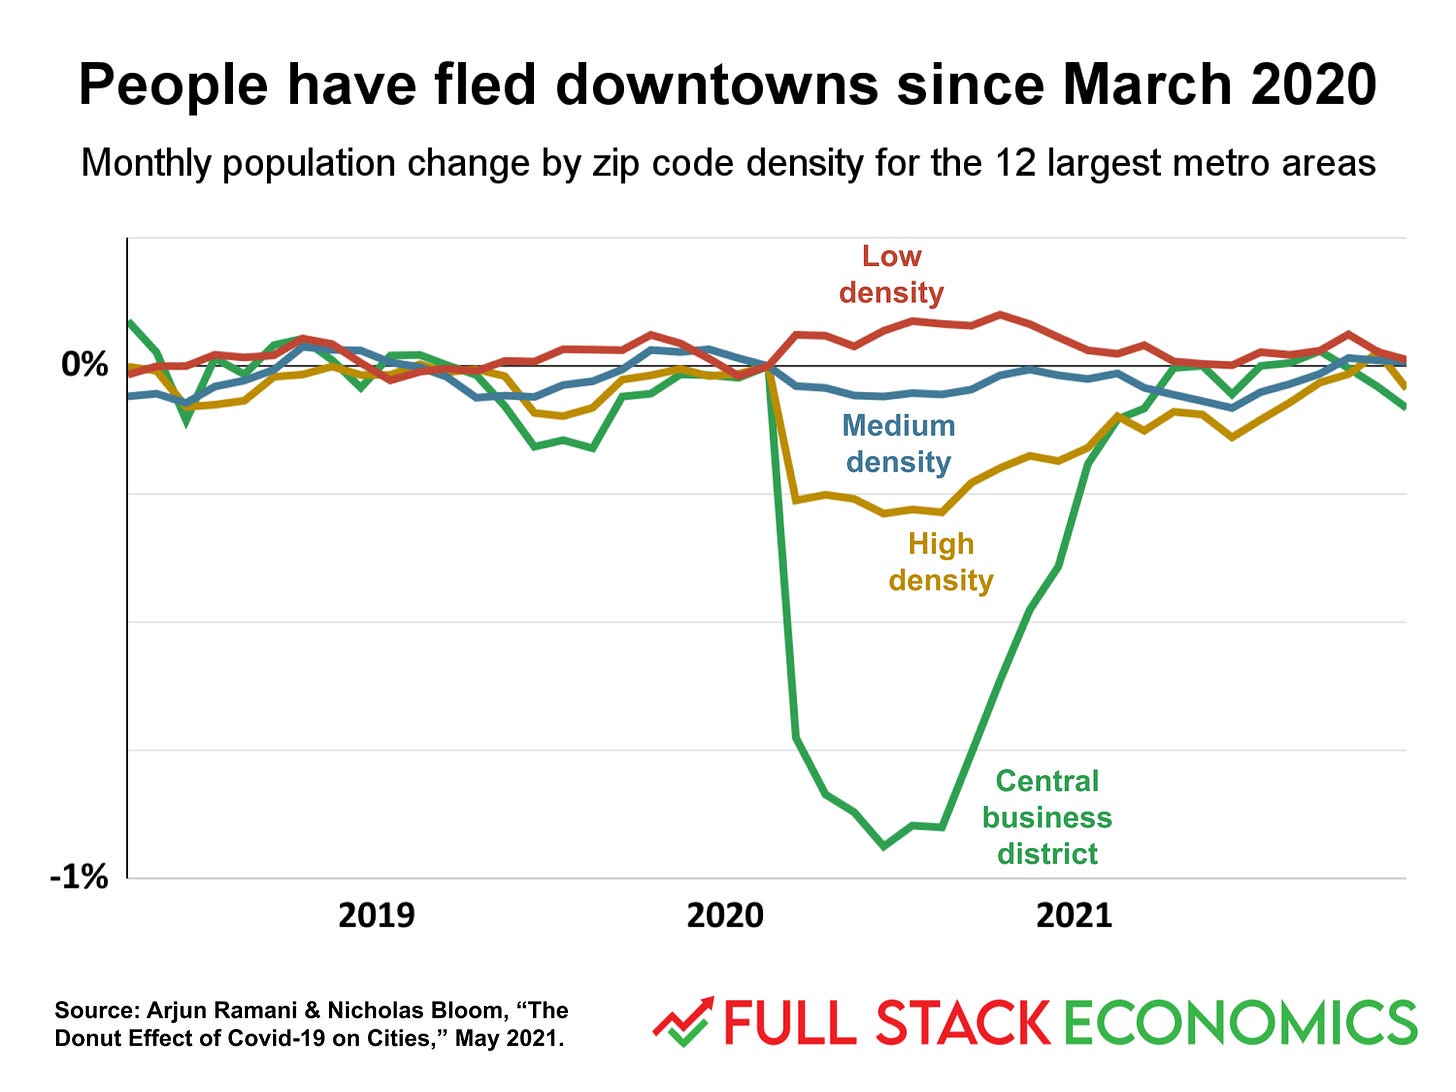
But last year, Ramani and Bloom published a systematic empirical analysis that demonstrated how the pandemic was hollowing out America’s biggest cities. They found that central business districts (defined as zip codes within 2 km of the city center) in the 12 largest metropolitan areas lost about 8 percent of their population (cumulatively) in the first two years of the pandemic. Meanwhile, low-density zip codes (those with densities below the median) grew by about 1 percent (thanks to Ramani for sharing updated data with me):
Ramani and Bloom found that this shift has had a big impact on rents:
Over the course of 2020, rents for downtowns and other high-density zip codes (defined as the densest 10 percent of zip codes) fell by about 10 percent. They have since rebounded, but are still only modestly above 2020 levels. In contrast, rents in low-density zip codes have risen more than 20 percent over the last two years.
The researchers found a similar divergence in home values for the 12 largest metro areas. The value of homes near downtown declined in 2020 and have yet to recover. Most other homes rose in value, with low-density zip codes seeing the biggest gains.
It’s important to note that these are all relative figures. In absolute terms, Washington DC is still denser and more expensive than Loudoun County, Virginia. Manhattan is still denser and more expensive than Dutchess County, New York. But the gap is narrower than it was in 2019.
The remote work revolution
Before the pandemic, the vast majority of jobs required workers to come into an office every day. The pandemic forced a sudden and dramatic change, as most white collar workers were not just allowed but required to work from home. Some workers moved to another part of the country to save money, enjoy more outdoor amenities, or be closer to family.
Most employers viewed this as a temporary expedient. But many workers enjoyed their newfound flexibility and some wondered if remote work could become a standard perk of a white-collar job.
Adam Ozimek, an economist at the Economic Innovation Group, is a leading expert on remote work and also a booster of the concept. Ozimek doesn’t think traditional offices will go away, but he believes remote work will become much more common in the coming years.
“I think we're heading toward one out of five jobs being fully remote,” Ozimek told me in a phone interview. While 20 percent of jobs might not seem like very many, it’s important to remember that only about 40 percent of jobs are capable of being done remotely. So Ozimek is predicting that about half of the white collar jobs that can be done remotely will be.
This would have dramatic implications for the future of American cities. White-collar jobs tend to pay more than other jobs. So if remote work catches on at the scale Ozimek predicts, millions of affluent professionals will have the option to live outside the major metropolitan areas where they live today.
Late last year, Ozimek conducted a survey for the hiring platform Upwork that found 2.4 percent of people had already moved due to remote work. Even more interesting, 9.3 percent of people expected to move in the future because of remote work opportunities.
Ozimek also pointed me to a new report from the job placement site Ladders that finds 24 percent of professional job postings now allow remote work. That’s up from 3 percent at the start of the pandemic. And significantly, Ladders found the share of remote jobs is still rising. So this trend may just be getting started.
Two models of remote work
A big unanswered question is whether we’ll see a lot of jobs go fully remote or if more companies will adopt a hybrid remote work model. In the hybrid model, employees work from home some days, while on other days they travel to the office for meetings.
Apple is pushing the hybrid model for employees at its Cupertino headquarters. Last month, Apple announced that employees will have to start coming into the office one day a week beginning on April 11. Starting on May 23, Apple employees will be required to come to the office on Mondays, Tuesday, and Thursdays. They’ll still be able to work from home on Wednesdays and Fridays. Google employees are supposed to come to the office three days a week starting this week.
Not everyone is happy with the change. Some anonymous Apple employees have threatened to quit if they’re forced to start commuting to work again—though it remains to be seen how many will follow through.
This standoff between employers and employees has big implications for the future of urban geography. If it becomes normal for employees to come into the office two or three days a week, that will continue to increase the value of homes at the edges of major metropolitan areas. Some people will accept longer commutes if they only have to do them a few times per week. Our largest metro areas will become even more sprawling but retain their primacy. In this scenario we should see a continuation of the donut effect.
On the other hand, if fully remote work becomes the norm, employees could leave major metropolitan areas altogether. In this scenario, we should see rapid population growth in lower-cost areas with attractive weather and amenities—areas like the Mountain Lion economies Alan wrote about last year. In this case, America’s superstar cities could become less important over time.


