The 2000s housing bubble was greatly exaggerated
Almost everyone misunderstood the housing boom—including the Federal Reserve.
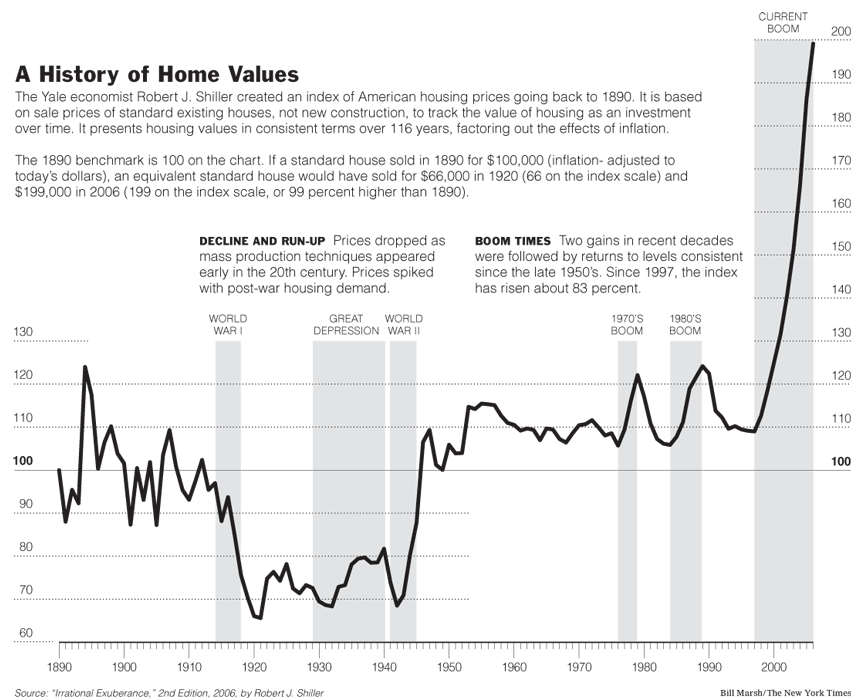
In 2006, the New York Times published a chart that I consider the defining image of the housing crisis. Based on data from the economist Robert Shiller, it showed how American home prices have changed over more than a century.
I remember being astonished by this chart when I first saw it, and I remember seeing it over and over as the crisis unfolded. It seemed to prove that something had gone seriously wrong with the housing market, and that it was only a matter of time before prices returned to normal levels.
For a few years after 2006, that forecast seemed to come true. Housing prices fell rapidly between 2007 and 2012. But then something surprising happened.
Today you can download the same data set from Robert Shiller’s website, updated to the present day. And it shows that housing prices are now above the supposedly unsustainable levels of 2006. And that’s after adjusting for inflation.
And yet not very many people think we’re in the middle of a second housing bubble. Rather, most experts believe that today’s housing prices reflect “fundamental” factors. Interest rates are at all-time lows, giving homebuyers more spending power. And regulatory restrictions have created housing shortages in many metropolitan areas.
But that leads to a question that at first glance might seem crazy: what if those same explanations largely explain the housing boom that peaked in 2006? What if the big problem in the early 2000s wasn’t an excess of houses but a shortage of them?
An alternative view of the housing crisis

That’s the thesis of Shut Out, a 2019 book by Kevin Erdmann, a scholar at the Mercatus Center. Erdmann’s book attracted little notice at the time it was published. But his thesis has gotten more plausible as housing prices have zoomed upwards over the last two years.
Erdmann argues that policymakers misdiagnosed the causes of the housing boom, and that led to catastrophic policy errors. In particular, because the Federal Reserve thought housing was overvalued in 2007, it didn’t cut rates fast enough in response to the housing crash. That helped turn what might have been only a mild, industry-specific downturn into a severe, economy-wide recession. And that recession, in turn, made the housing crisis bigger than it needed to be, since many previously solvent homeowners lost their jobs or saw their mortgages go under water.
This view is shared by Gregor Schubert, a UCLA professor who recently earned his economics PhD studying the housing crisis at Harvard.
“To me, the strongest piece of evidence in favor of the recession causing the housing crisis rather than the housing crisis causing the recession is the fact that prices snapped back up, in similar geographic configuration, after the economy has recovered,” Schubert told me.
Schubert points out that the places with the highest 2006 prices, like Los Angeles, did relatively well during the Great Recession and “took off like a rocket ship afterwards.” In contrast, cities that didn’t experience much of a bubble, like Atlanta, suffered big home price declines in the crash. That, he said, suggests that the housing crash was driven by broader macroeconomic factors more than an oversupply of homes in any particular part of the country.
If Erdmann and Schubert are right, we’re still living with the consequences of misdiagnosing the housing boom as a speculative bubble. After the crash, housing construction fell to its lowest level in decades, and remained depressed for several years. That under-production contributed to the housing shortages that now plague much of the country.
There was never a national housing glut
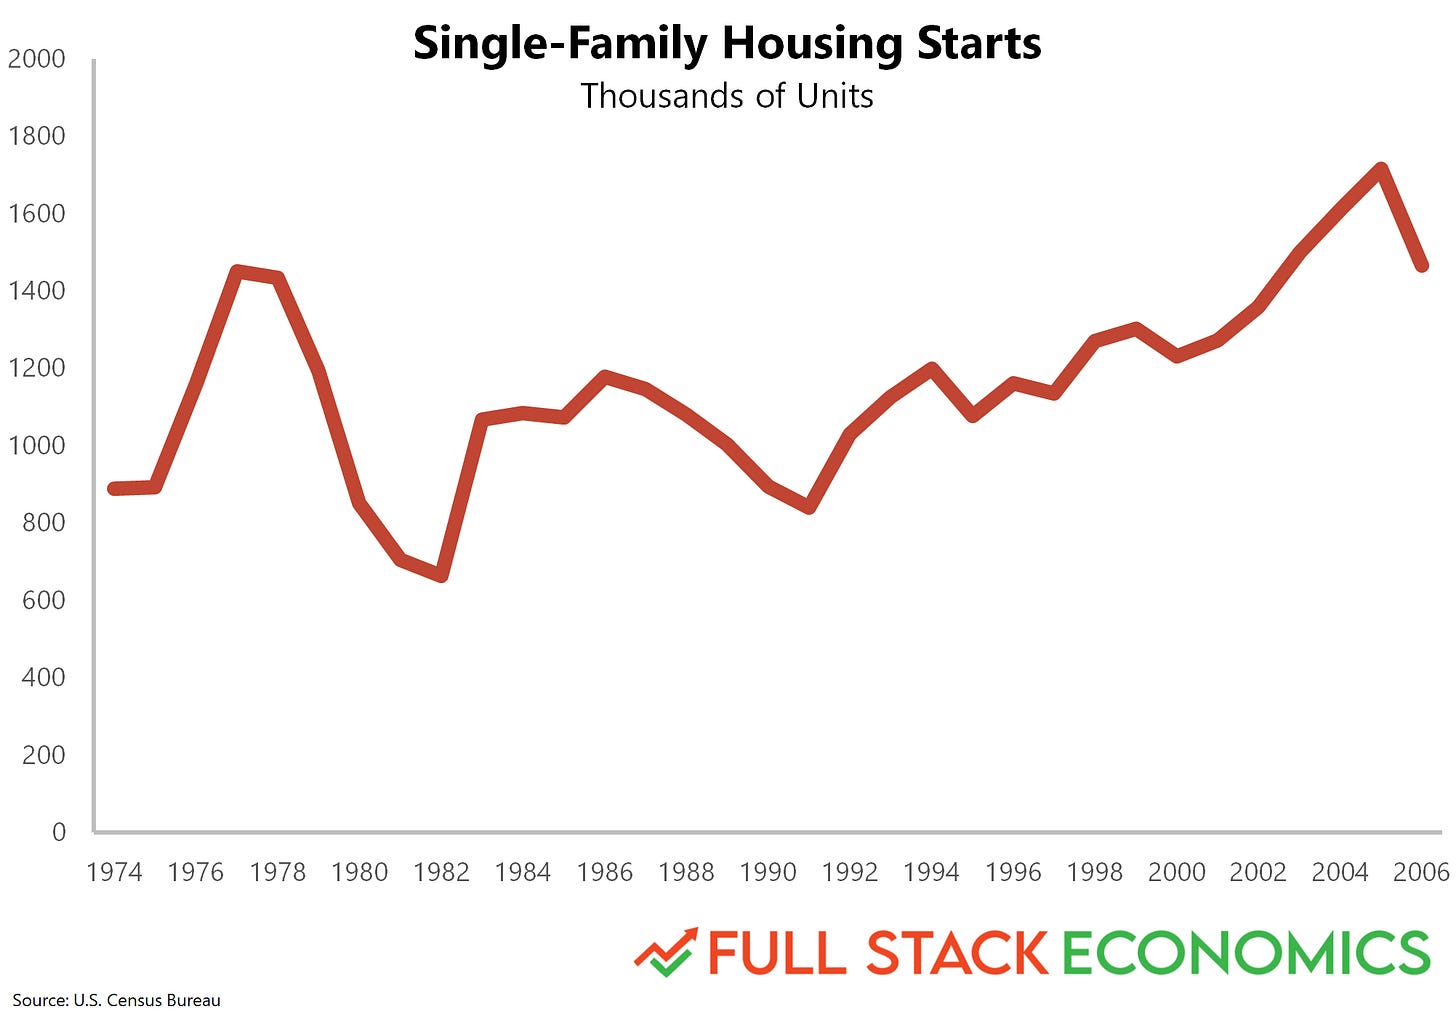
The idea that the 2000s housing boom reflected a housing shortage probably sounds wrong to you. After all, “everyone knows” that the mid-2000s saw an unprecedented building boom. Here’s a chart of single-family housing starts between 1974 and 2006:
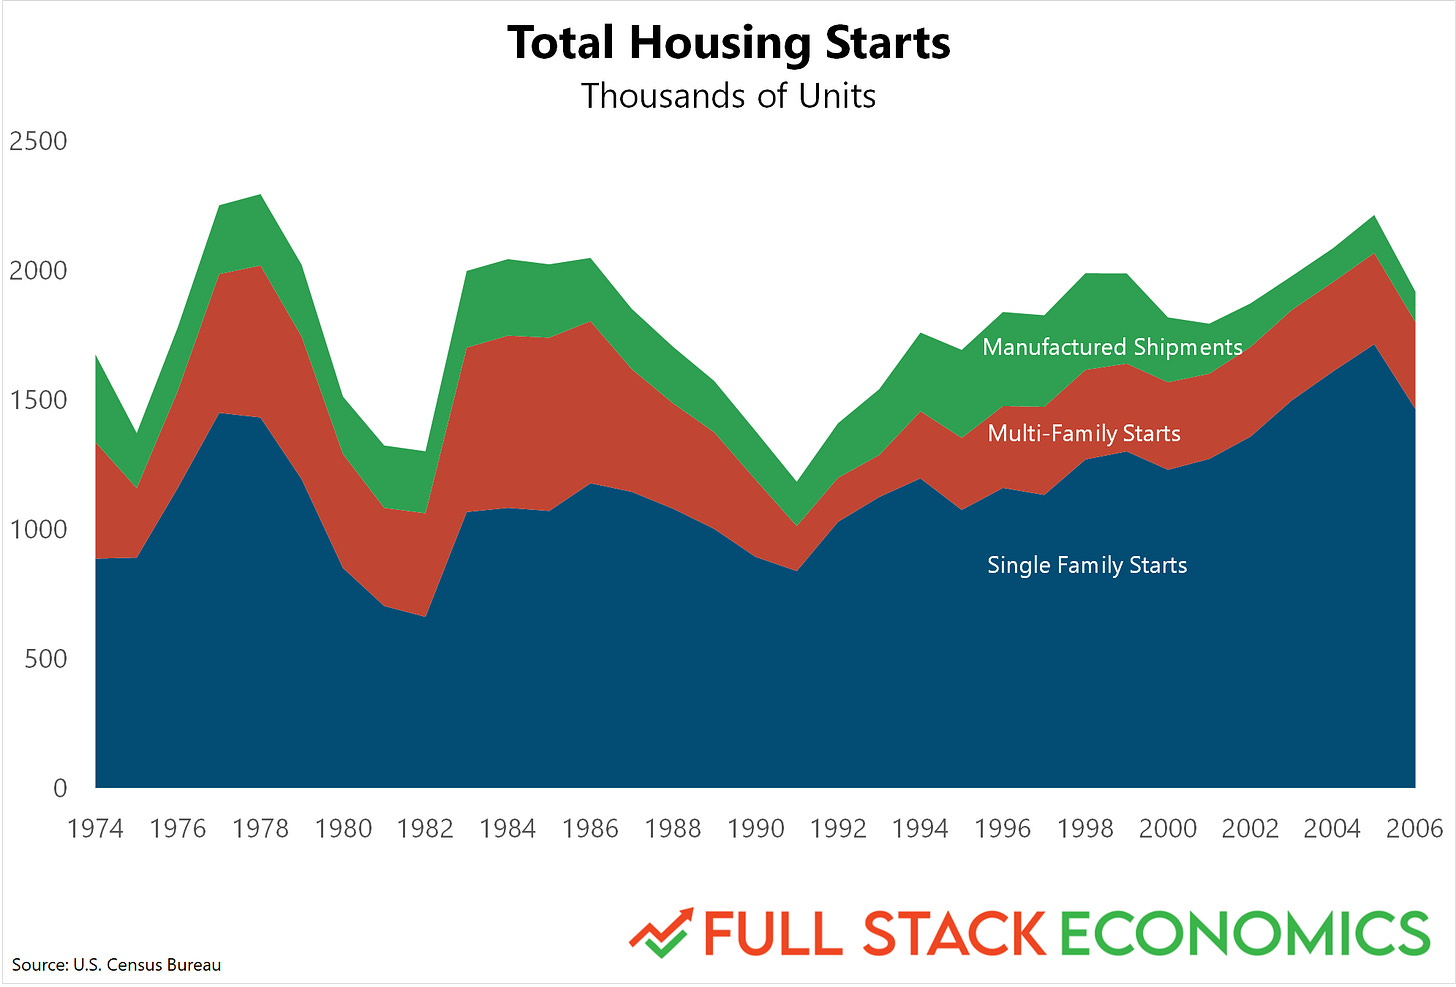
This chart shows a clear upward trend from 1980 through 2005, with housing starts reaching an all-time record in 2005. However, single-family houses aren’t the only types of home! People also live in multi-family apartment buildings and in manufactured homes. When you factor in those additional housing types, things look different:
Here I’ve stacked up the three types of housing to show the total number of homes constructed each year. Over the 30 years between 1975 and 2005, there was a consistent pattern where homebuilding peaked around 2 million units during each economic boom. Total housing production in 2005 was actually slightly below the all-time high of almost 2.3 million units reached in 1978.
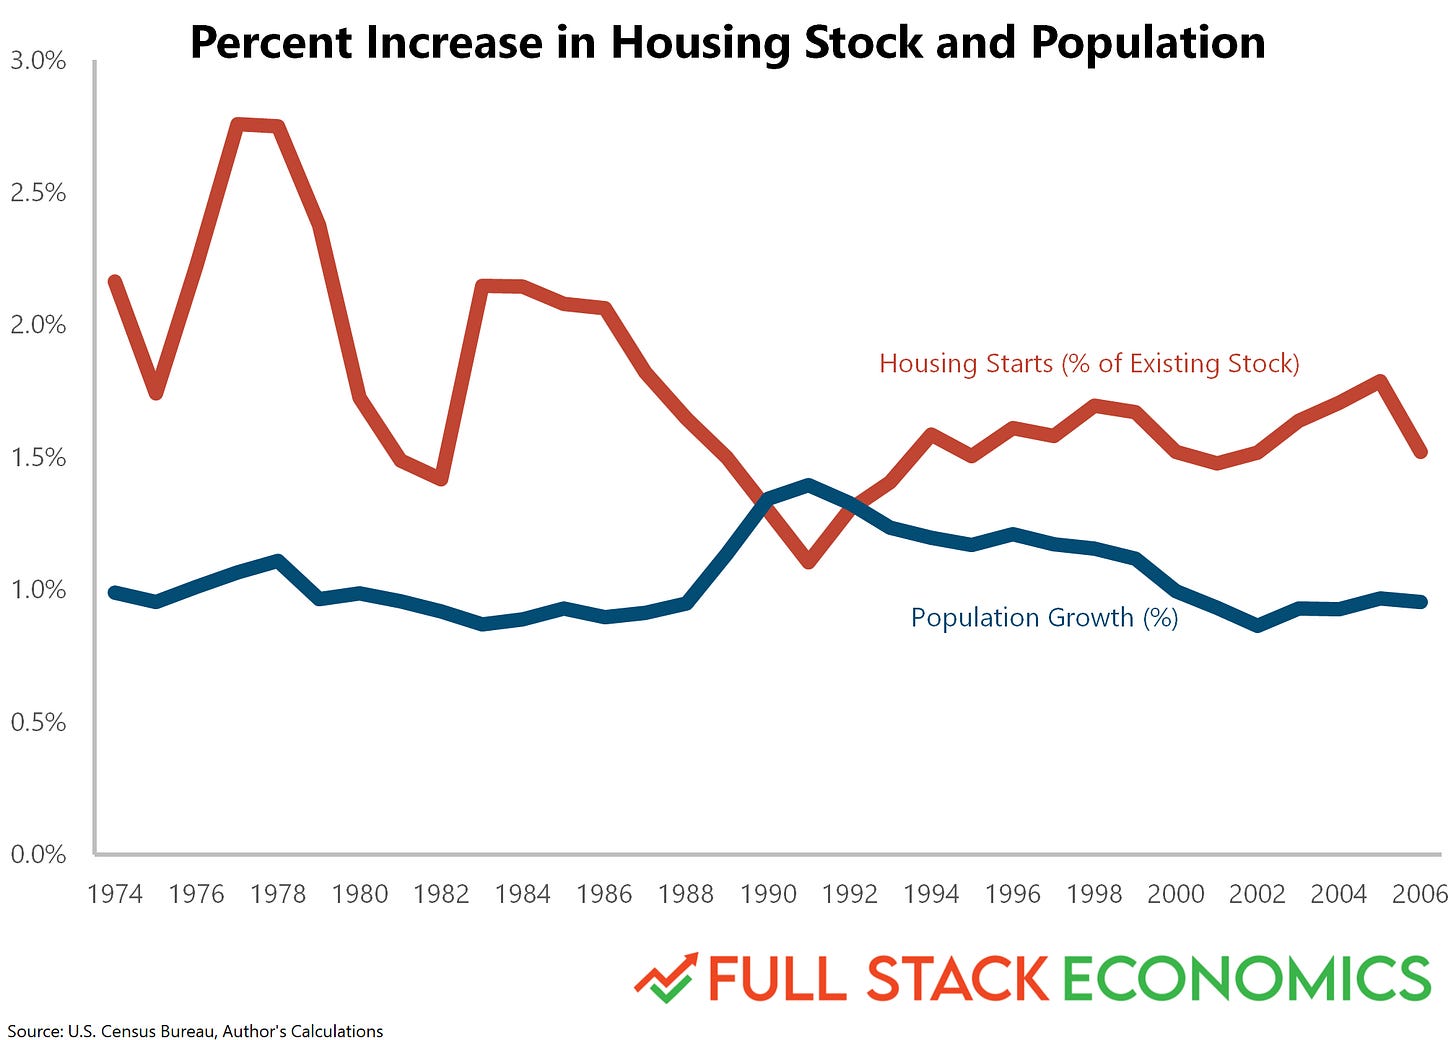
And even this chart makes the 2005 housing boom look more impressive than it actually was, because it doesn’t factor in population growth. A better way to judge the pace of homebuilding is to compare the growth of homes to the growth of people:
Here I took the top line from the previous chart and divided it by the total number of housing units to get a growth rate of homes in red. I compare this to the growth rate of people in blue.
As you can see, it used to be common for the housing stock to grow more than 2 percent in a year. But after the growth rate of homes fell below 2 percent in 1987, it never reached that level again. New homes in 2005 accounted for 1.8 percent of housing inventory, an 18-year high, but far below the peak construction rates of the late 1970s and early 1980s.
And this slowdown in housing construction can’t be explained by a slowdown in population growth. The nation’s population was growing at around the same rate—just under 1 percent—in the mid-1970s and the mid-2000s.
Metros with limited housing supply had higher prices
Of course, even if there wasn’t a national housing glut, there still might have been oversupply in particular cities. So let’s get more granular.
When people think of the housing boom, they think of two things: a boom in home prices and a boom in building construction. You can find examples of both things happening in the early 2000s. But to a large extent, they happened in different places.
Superstar cities like San Francisco, Los Angeles, New York, and Boston saw home prices soar to record levels, but these cities were building homes at rates far below the national average. Strict regulations prevented the construction of new homes, so rising demand drove big increases in home prices.
On the other hand, cities like Atlanta, Dallas, and Minneapolis had strong economies and significant housing demand in the 2000s, but they coped with it by building a lot of housing. So prices rose only modestly.
If every American city fell into one of these two categories, it might have been obvious that what was happening in the 2000s was not a “housing bubble” but simply an object lesson in the importance of adequate housing supply. Cities with ample housing supply maintained moderate home prices. Cities that didn’t, didn’t.
What made the 2000s confusing was that there was a third category of cities that had rapid housing growth and rapidly rising home prices. These included Phoenix, Las Vegas, Miami, Tampa, and California’s Inland Empire. If you wanted to make the case that the US was in the throes of an irrational housing bubble, these were the cities to focus on.
In Phoenix, for example, home prices doubled between 2001 and 2006, even though the Phoenix metro area was building homes at a record pace. New housing permits in the Phoenix area rose from 41,000 in 2001 to 63,000 in 2004—far more than the 37,000 housing permits in the much larger Los Angeles area. Yet home prices in Phoenix still rose by 17 percent between those three years—and then another 54 percent between 2004 and 2006.
The combination of rapid building and soaring prices in cities like Phoenix led many people to conclude that this was an irrational and unsustainable housing bubble. You couldn’t say the high prices were the result of limited housing supply because Phoenix was building homes at a brisk pace.
But Erdmann has a different interpretation—one that’s backed up by Schubert’s empirical work: the housing booms in these cities were largely driven by underbuilding in the superstar cities.
The spillover hypothesis

In the 1990s and early 2000s, a lot of college-educated people moved to Silicon Valley for high-paying jobs at technology companies. Housing was scarce, but the new workers made enough money to outbid locals for market-rate apartments. As rents and home prices rose, middle- and working-class locals found it harder and harder to afford housing. Every year, thousands of them fled the San Francisco Bay Area for more affordable housing elsewhere.
These lower-earning workers didn’t disperse randomly across the country. Many moved to Phoenix, which was also getting a lot of inbound migrants from Los Angeles. The overall scale of California-to-Arizona migration was massive. In 2005, for example, Arizona welcomed about 90,000 new residents from California—1.5 percent of Arizona’s population.
Many of these people weren’t wealthy enough to afford a home in Los Angeles or San Francisco, but they weren’t necessarily poor either. Many could comfortably afford to buy a house in a less expensive housing market like Phoenix.
Erdmann has lived in Phoenix since the 1990s, so he got to see this process first-hand. “You can go around and talk to people at neighborhood parties here and a good portion of them will say ‘we were in San Francisco and couldn't afford it any more,’” he told me.
A similar story applies to most of the other cities we think of as typifying the housing bubble. Around 50,000 people moved from California to Nevada in 2005, with many settling in booming Las Vegas. Other Angelenos were moving to the Inland Empire, which the Census Bureau considers a separate metropolitan area from Los Angeles but is only about an hour’s drive away.
On the East Coast, hundreds of thousands of New Yorkers and Bostonians moved to Florida in the early 2000s, driving housing booms in Orlando, Tampa, and Miami.
In effect, superstar cities were outsourcing their housing development problems. In the early 2000s, the Phoenix area was expanding its housing stock quickly to accommodate the flood of California refugees. But there’s an inherent limit to how quickly a region can build new houses. So even with the high rate of housing production in Phoenix, prices still rose.
In a empirical paper published earlier this year, Schubert found a causal connection between inter-city migration and home price spillovers. The more people who move between two cities, the more home prices will “spill over” from one city to the other. When San Francisco housing gets more expensive, people move to Phoenix and Phoenix housing gets more expensive too.
The conventional view holds that rising home prices in Phoenix and Las Vegas were driven by speculators hoping to find a “greater fool” who would pay an even higher price—or by gullible consumers, likely financed by subprime loans, who didn’t realize they were getting a bad deal. But the migration story suggests another possibility: middle-class homebuyers were coming from Los Angeles or San Francisco and simply saw Phoenix homes as a bargain.
I ran this theory by Mark Calabria, a Cato Institute scholar who ran the Federal Housing Finance Agency under President Trump.
“Migration trends very clearly show growth into Phoenix from places like California,” Calabria acknowledged. “A lot of the supply response in Phoenix was demand by people not being able to live in San Francisco. But I would still argue that we overbuilt in Phoenix at the time.”
Rents weren’t rising
Dean Baker is a left-leaning economist at the Center for Economic and Policy Research. He’s known as one of the first experts to “call” the housing bubble. Way back in 2002, he wrote an article bluntly concluding that “there is a housing bubble” that “must eventually come to an end.” Two years later, he put his money where his mouth was, selling his condo in Washington DC and renting a home while he waited for the bubble to pop. It turned out to be a smart move, as he was able to buy back into the market near its low point in 2009.
Baker has continued to defend the bubble thesis, most recently in a 2018 paper. So I thought he’d be the perfect person to poke holes in Erdmann’s arguments.
One of Baker’s strongest points is that vacancy rates were high throughout the housing boom. “The vacancy rate grew rapidly in the decade of the 2000s, peaking around 2008,” Baker told me. “That’s not consistent with the story of a housing shortage.”
As you can see above, almost 11 percent of housing units were vacant in 2000. That was near the highest level in decades, and the vacancy rate rose even more during the early 2000s. If the nation were suffering from an acute housing shortage during this period, we should have expected vacancy rates to move in the other direction.
This is a good point as far as it goes. But I find it striking that vacancies never really decline during the 1980 to 2010 period. If vacancies had been low in the 1990s and then shot up during the 2000s, that would be strong evidence that there was an over-supply of housing. But the gradual rise makes me wonder whether there were longer-term forces pushing up the vacancy rate.
I’m not sure what that might be. Maybe people were buying more vacation homes. Maybe people were moving away from rust-belt cities and leaving vacant homes behind. Maybe the Census Bureau was getting better at counting vacant properties. Without knowing where these vacancies occurred and why, it’s hard to know if they are bubble-related or not.
Baker also points out that home prices rose much faster than rents during the early 2000s. The chart below compares inflation-adjusted rents to inflation-adjusted home prices—with both indexed to be equal in 2000.
As you can see, rents have only marginally outpaced inflation over the last 30 years, while home prices have been much more volatile. Baker argues that if housing shortages had been the primary force pushing up home prices in the 2000s, we should have seen rents rising at the same time.
This is a great point, and it convinces me that the 2000s housing boom wasn’t entirely driven by housing shortages in a few coastal cities. At the same time, I don’t think it comes close to proving that the run-up in prices in the early 2000s was entirely a speculative bubble.
Much of the divergence between home prices and rents during the early 2000s can be explained by falling interest rates. Suppose a family can afford to pay $1,000 per month on a mortgage. In 2000, they would have gotten a mortgage at around 8 percent; that would have enabled them to borrow around $135,000. By 2004, interest rates had fallen to 5.8 percent, so they could have borrowed $170,000 with the same $1,000 monthly payment.
So falling interest rates enabled families to buy roughly 25 percent more house in 2004 than they could buy in 2000 with the same monthly payment. That means falling interest rates can explain almost all of the 28 percent increase in the ratio of home prices and rents between 2000 and 2004.
If you had taken a snapshot of the housing market in early 2004, things would have looked pretty normal. Home prices in San Francisco and Los Angeles were soaring because of local housing shortages. In most other places, prices had risen modestly thanks to falling interest rates. There were a few places where prices seemed to be going crazy—especially Las Vegas and Miami. But this wasn’t the first time in American history that a few local housing markets had dramatic boom-and-bust cycles.
But the last two years of the housing boom are harder to explain. Between January 2004 and January 2006, national home prices rose an additional 20 percent, adjusted for inflation, at a time when rents were trending down and mortgage rates were trending up. Home prices got especially crazy in Las Vegas (up another 48 percent, inflation adjusted, in two years), Phoenix (up 64 percent), and Miami (up 52 percent).
So I think it would go too far to say there was no housing bubble at all during the 2000s. Things clearly got frothy near the end. The high prices of 2005 were probably not sustainable. Some correction was probably inevitable, at least in a few cities.
However, people wrongly concluded that the entire national housing boom of the 2000s was a speculative bubble. They came to believe that prices were far above levels that could be justified by fundamentals, and that there were millions of excess homes.
The Fed botched the housing downturn

This mistake had profound consequences because the perceived size of the housing bubble influenced decision-making by the Federal Reserve. The Fed started raising its benchmark interest rate in 2004, reaching a peak of 5.25 percent in mid-2006. Part of the Fed’s goal was to raise mortgage rates and thereby cool a housing market it viewed as overheated.
The policy worked—too well, as it turned out. New housing starts peaked in early 2006 and began to fall. By June 2007, new home starts were at their lowest level in a decade, and home prices were falling.
At this point, the Fed faced a crucial choice: when and how quickly to cut interest rates. Cutting earlier and more aggressively would have provided a cushion for the housing market by pushing down mortgage rates and luring new buyers into the market. An early rate cut also would have sent a signal that the Fed wasn’t going let the bottom fall out of the housing market. That would have boosted the confidence of homebuilders and might have limited job losses in the construction sector. This would have been a no-brainer if the Fed had believed that the housing boom had been mostly healthy with a bit of froth at the end.
But things looked different if you believed that a massive housing bubble had bequeathed the country with millions of extra housing units that needed to be “worked off.” In that scenario, aggressive rate cutting would have merely been delaying an inevitable reckoning. Even worse, it might have allowed the bubble to get even bigger, leading to an even bigger crisis a few years down the line. In this view, keeping rates high at 5.25 percent was tough but necessary medicine.
Unfortunately, the Fed took this latter approach. The central bank held rates at 5.25 percent at its June 2007 meeting and maintained the same rate in August. New housing starts plunged another 20 percent between June and September, and the decline of home prices accelerated.
Meanwhile, the employment situation was deteriorating, if subtly at first. The summer of 2007 had a couple months of negative job growth, though this was not apparent until later data revisions. Even in the good months, job growth was slower than population growth. By the time the Fed cut rates in September, it was too late to prevent the onset of the Great Recession in December 2007.
Today, many people believe that the severity of the 2007 housing crisis was made inevitable by the size of the housing bubble. But Erdmann and Schubert’s analysis convinced me that that’s not true.
A large portion of the housing boom between 2000 and 2006 was driven by the fundamentals. If there was over-building in 2004 and 2005, it was modest in scale and limited to a handful of metropolitan areas. If homes were overpriced at the end of 2005, it was probably by 10 or 15 percent nationally, not 30 percent.
If the Fed had understood this at the time and acted accordingly, it could have averted a lot of human misery. Home prices would not have fallen so much, and fewer people would have lost their jobs. That, in turn, would have limited the losses of banks that bet on the mortgage market, and might have prevented the 2008 financial crisis.
Other countries had big booms without big busts
You’re probably still skeptical of the claim that the post-bubble crash didn’t need to be so severe. So I’ll close with this chart, which compares US housing prices to some of our peer countries:
In the first half of the 2000s, Canada, the United Kingdom, and France all had housing booms that looked a lot like ours. The shape of the French bubble was eerily similar to our own, while British home prices rose even faster.
But starting in 2006, our housing market diverged from theirs. US housing prices fell by more than 30 percent. Home prices in the UK, France, and Canada zoomed upward for another year or two, then fell by 18, 8, and 7 percent, respectively. Prices then rebounded more quickly in all three countries.
It’s hard to look at this chart and maintain that the depths of the 2008 housing crash was foreordained. Canada, France, and the UK have economies similar to our own, and they all experienced housing booms like ours. But none of them suffered crashes that were anywhere close to ours. Perhaps with better policies, we could have had a smaller, gentler housing bust too.


