Ask me anything! (and a sneak preview)
Two charts illustrate how American living standards have improved since the 1980s.
Happy Wednesday! I haven’t posted much this month because I’m hard at work on a big piece about changes in American living standards. Using the format of my popular January piece “18 charts that explain the American economy,” the article will explore the many ways American living standards have changed over the last 30 to 50 years.
Many Americans are worried about the high cost of housing and health care. The piece will, of course, explore how those important sectors of the US economy have become more or less affordable over time. But I also want to point out some of the less obvious ways that we’re living better than our parents. To whet your appetite, I’ll share two examples here. This is a subscriber-only post, so please don’t share these charts yet—they’ll both be part of the public post that will be out in a week or two.
But first, I'd like to ask a favor. I want to answer reader questions for this Friday’s edition of Short Stack. Short Stack is limited to paid subscribers, which means we'll have a much smaller pool of potential question askers. So I'd be grateful if you could click the title of this post and leave a comment with a question you’d like me to answer. Thanks in advance!
The fresh fruit boom
One of my six-year-old daughter’s favorite books is The Berenstain Bears and the Mama's Day Surprise. The premise is that Mama Bear knows she’s getting breakfast in bed for Mother’s Day but has to pretend otherwise to avoid ruining it for her husband and kids. At one point, she’s looking for blueberries but can’t find them at the grocery store because “it was much too early in the season for blueberries.” She “looked high and low for blueberries, but there were none to be found.” Luckily, “it turned out that Gran had frozen some last season.”
The idea of being unable to find blueberries at the grocery store is totally alien to my kids. Today, fresh blueberries are available year-round, and almost always at reasonable prices. The book isn’t even that old—it was published in 2004—but the fruit market has changed a lot since then. According to the USDA’s Economic Research Service, per capita availability of blueberries has increased by a factor of four since 2004. (Availability measures the weight of food offered for retail sale—including food that’s actually sold and food that is discarded after spoiling.)
In this chart I use the same USDA data to look further back in time. Since the late 1980s, blueberry availability has risen by a factor of eight. Mangoes, limes and pineapples have also seen massive growth, while availability of cherries and strawberries have more than doubled. I didn’t include raspberries on the chart because raspberry availability was too small to measure until around 2000. Since then it’s grown by a factor of eight—from 0.1 pounds per person to 0.8 pounds.
Not all fruits have become more popular over the last 30 years. In the 1980s, people ate a lot of citrus fruits—mostly oranges and grapefruit—as well as apples, bananas, and melons. Most of those fruits have declined over time as people shifted to other options. Still, overall fruit availability has improved by 17 percent over the last 30 years. We’re eating more total fruit while enjoying a much wider selection year-round.
Cars and trucks keep getting better
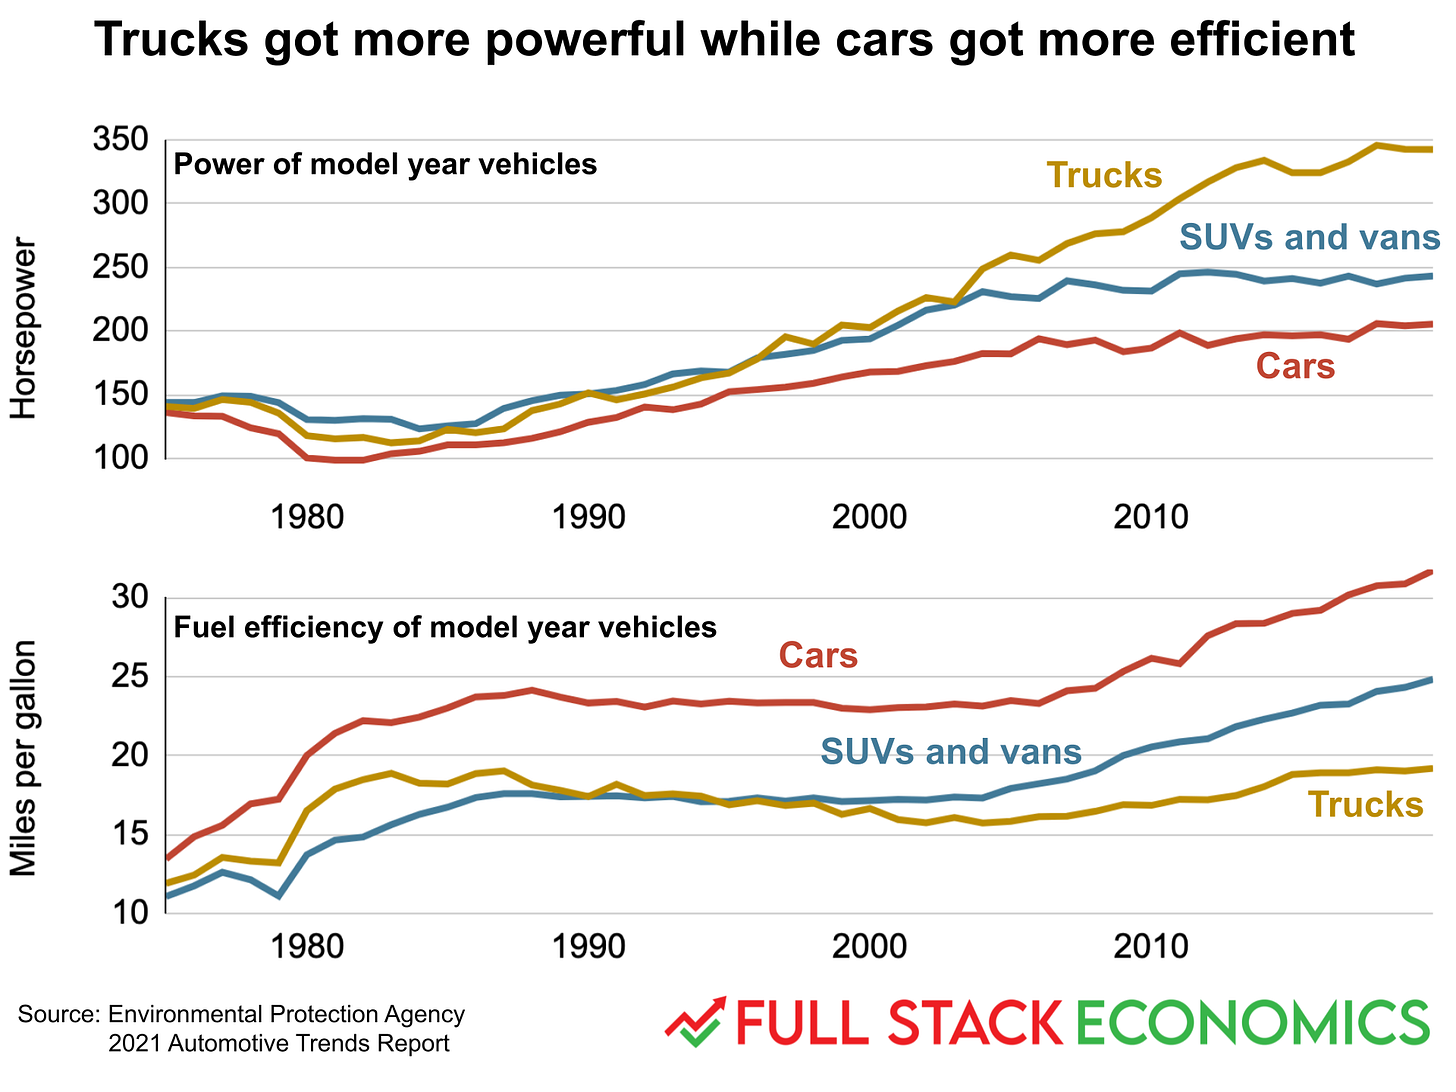
Engine designers face a basic tradeoff between power and fuel efficiency. And as this chart shows, automakers have gone in different directions with their cars and trucks, respectively.
Every category of vehicle saw a substantial jump in fuel efficiency in the early 1980s, a time of historically high gasoline prices. Then as gasoline prices fell in the late 1980s and 1990s, fuel efficiency stagnated—especially for pickup trucks, which were actually less fuel-efficient in 2013 than they had been in 1983.
Still, by 2020 every category of vehicle—pickup trucks, SUVs, and passenger cars—were more efficient than they’d ever been. But cars made by far the most progress: the average car could go twice as far on a gallon of gas in 2020 compared to 1977.
Meanwhile, pickup trucks have gotten much more powerful. The average pickup truck in 2020 had a 342 horsepower engine—double the 1995 average. Passenger cars have also gotten more powerful—albeit at a slower rate. The average sedan or wagon in 2020 had a 205 horsepower engine, double the typical car from the early 1980s.
In short, today’s vehicles are both more fuel efficient and more powerful than the vehicles our grandparents drove 45 years ago. Trucks are a lot more powerful and a little bit more fuel-efficient. Cars (and SUVs) have seen substantial gains in both dimensions.


