9 charts that show the economy is kind of a mess right now
The Federal Reserve is getting mixed signals from economic data.
Prices rose by 7.1 percent over the last year, the Bureau of Labor Statistics (BLS) announced yesterday. That’s the lowest annual inflation rate we’ve seen this year, but it’s still far above the Federal Reserve’s 2 percent target. Markets expect the Fed to announce a 0.5 percent interest hike this afternoon to help bring the inflation rate down.
The last time I wrote about the inflation situation, ahead of the Fed’s September meeting, inflation was surging out of control. At that point it seemed clear that rapid rate hikes were needed to bring inflation down. That’s exactly what we’ve gotten, with four 0.75 percent rate hikes since May.
Today the economic signals are more mixed. Some data suggests that the economy is slowing rapidly and may be headed for a recession. But by other measures the US economy is still firing on all cylinders.
Below are nine charts to help you understand this complex and fast-changing picture. Some of them will be familiar from my September story. But with three additional months of data, they may tell a different story than last time.
1. A good start, but not enough
Headline inflation peaked at around 9 percent in June and has come down fairly steadily since then. That suggests that the Fed’s rate hikes are working and it might be time to stop hiking soon.
However, core inflation—which excludes volatile food and energy prices—has held relatively steady at around 6 percent over the course of 2022. That suggests a less optimistic interpretation: that rate hikes have accomplished little more than preventing further escalation in the inflation rate.
Throwing out food and energy is a bit arbitrary, especially since those are two of the most significant items in many people’s budgets. So the Cleveland Fed computes median inflation, which tries to ignore volatile outliers in a more rigorous way by focusing on the CPI component in the middle of the inflation distribution. The latest reading, from October, shows inflation continuing to increase—an ominous sign for the Fed.
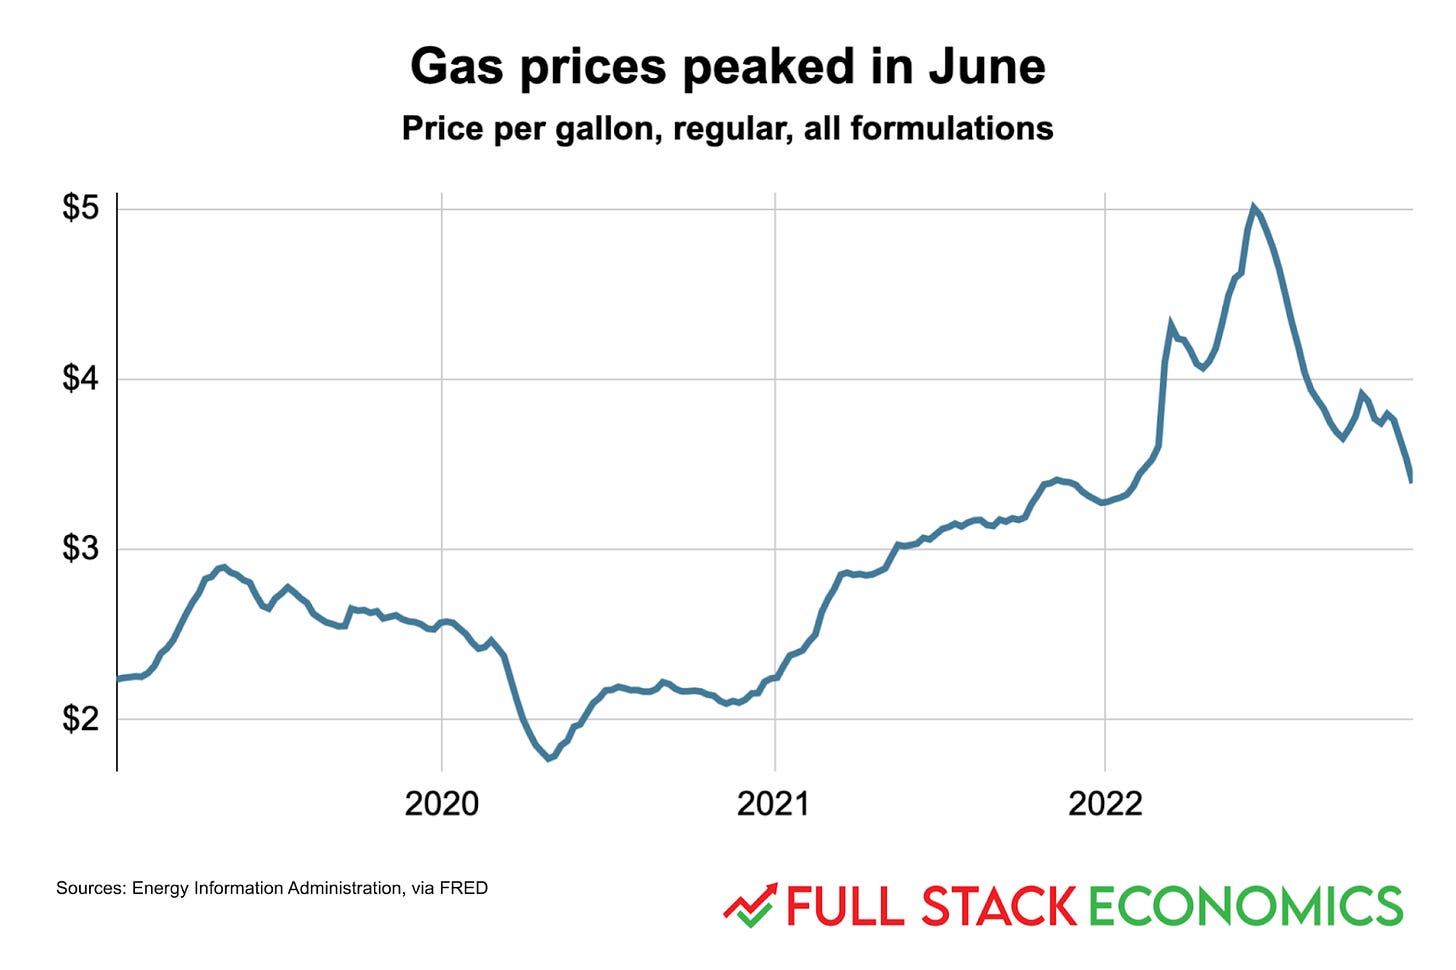
2. Gasoline prices have been falling since June
If I had to pick one chart to explain why inflation has fallen since June, it would be this one. Gasoline prices nationally peaked at $5 per gallon in mid-June. Not coincidentally, inflation peaked at 9.1 percent that same month.
Gasoline accounts for around four percent of the average American household’s budget, and hence it’s around four percent of the CPI. However it has outsized influence on the headline inflation rate because it is far more volatile than other CPI components. Gasoline prices shot up 60 percent between June 2021 and June 2022, which means that gasoline accounted for more than 2 percentage points of that month’s 9.1 percent inflation rate.
But since June, gas prices have been falling, dragging the headline inflation rate down. By November 2022, a gallon of gas was only about 10 percent more expensive than it had been a year earlier. This change alone explains most of the 2 percentage point decline in the overall inflation rate between June and November.
3. A mixed picture on rents
This chart might be the best illustration of the dilemma the Fed faces right now. I’ve charted year-over-year changes in three different measures of rent: the “rent of primary residence” component of the CPI, plus private-sector indexes from Zillow and Apartment List.
As longtime Full Stack Economics readers know, these measures diverge because they’re measuring different things. The two private-sector data sets measure changes in “spot rents”—rents paid by tenants who sign new leases. In contrast, the BLS measures rents across the entire economy, which includes tenants whose rent was locked in by a lease they signed many months ago. For this reason, the BLS rent index tends to lag the Zillow and Apartment List indices by about 12 months.
The Zillow and Apartment List data show a rapid decline in the inflation rate for spot rents (indeed, on a month-to-month basis prices have actually been falling for a couple of months). But average rents across the economy are still rising rapidly as year-old leases get renewed at new, higher rents.
4. Hiring remains robust
An economy heading into a recession isn’t supposed to look like this. Last month, the economy created a 263,000 new jobs. That was the fewest new jobs created in 2022 (or 2021 for that matter), but it was still far above the average rate of job creation in previous economic expansions. Between February 2010 and February 2020, for example, the economy added an average 190,000 jobs per month.
That’s obviously great news for anyone looking for a job right now. But it could be a worrying sign for the Fed, since it might mean the Fed has not done enough to curb demand.
5. There are still lots of job openings
Here’s another way of illustrating the same issue. This chart compares the unemployment rate (workers looking for work divided by total workers) to the job vacancy rate (open jobs divided by total workers). As you can see, there are typically more workers across the economy than job openings. When the economy gets really strong—as it did in 1999 and 2019—then the two figures come close to parity.
By this measure, the last year has seen the tightest labor market in many decades, with almost two open jobs per unemployed worker.
6. The end of the durable goods boom
One of the most important categories driving the inflation over the last 18 months has been durable goods—products like cars, furniture, and household appliances. For many years prior to 2020, the cost of durable goods consistently fell thanks to globalization and improvements in manufacturing productivity. But in the months after the pandemic, this trend reversed as people shifted spending from services (like bars and restaurants) to durable goods for the homes in which they were suddenly spending more time.
The result was a huge increase in the cost of durable goods. At its peak in early 2022, durable goods inflation reached 18 percent. But now the durable goods boom is coming to an end. Annual durable goods inflation fell to a modest 2.4 percent in November 2022. In a few more months, we might be back to the historical pattern where we enjoy gentle durable-goods deflation year after year.
The concern for the Fed is that services inflation has been rising as durable goods inflation falls. And services account for much more of the average household’s budget than durable goods. However, the services category includes housing, and as we’ve seen the CPI’s measure of housing inflation tends to run about a year behind spot rents. So the services line may start coming down in a few more months.
7. Imports are starting to fall
When ports became overloaded last year, some people thought they were suffering from new, COVID-related logistical problems. But that was mostly wrong—the main issue was just that Americans were ordering a ton of stuff from overseas. Between mid-2020 and mid-2022, monthly imports (measured by TEUs, a unit of volume) to six major ports were about 18 percent above the pre-COVID norm.
Now that import boom may be coming to an end. Imports in October 2022 were about 12 percent below August levels, and also more than 12 percent below the levels of October 2021 and October 2020. That suggests that demand for tradable goods is softening in the United States.
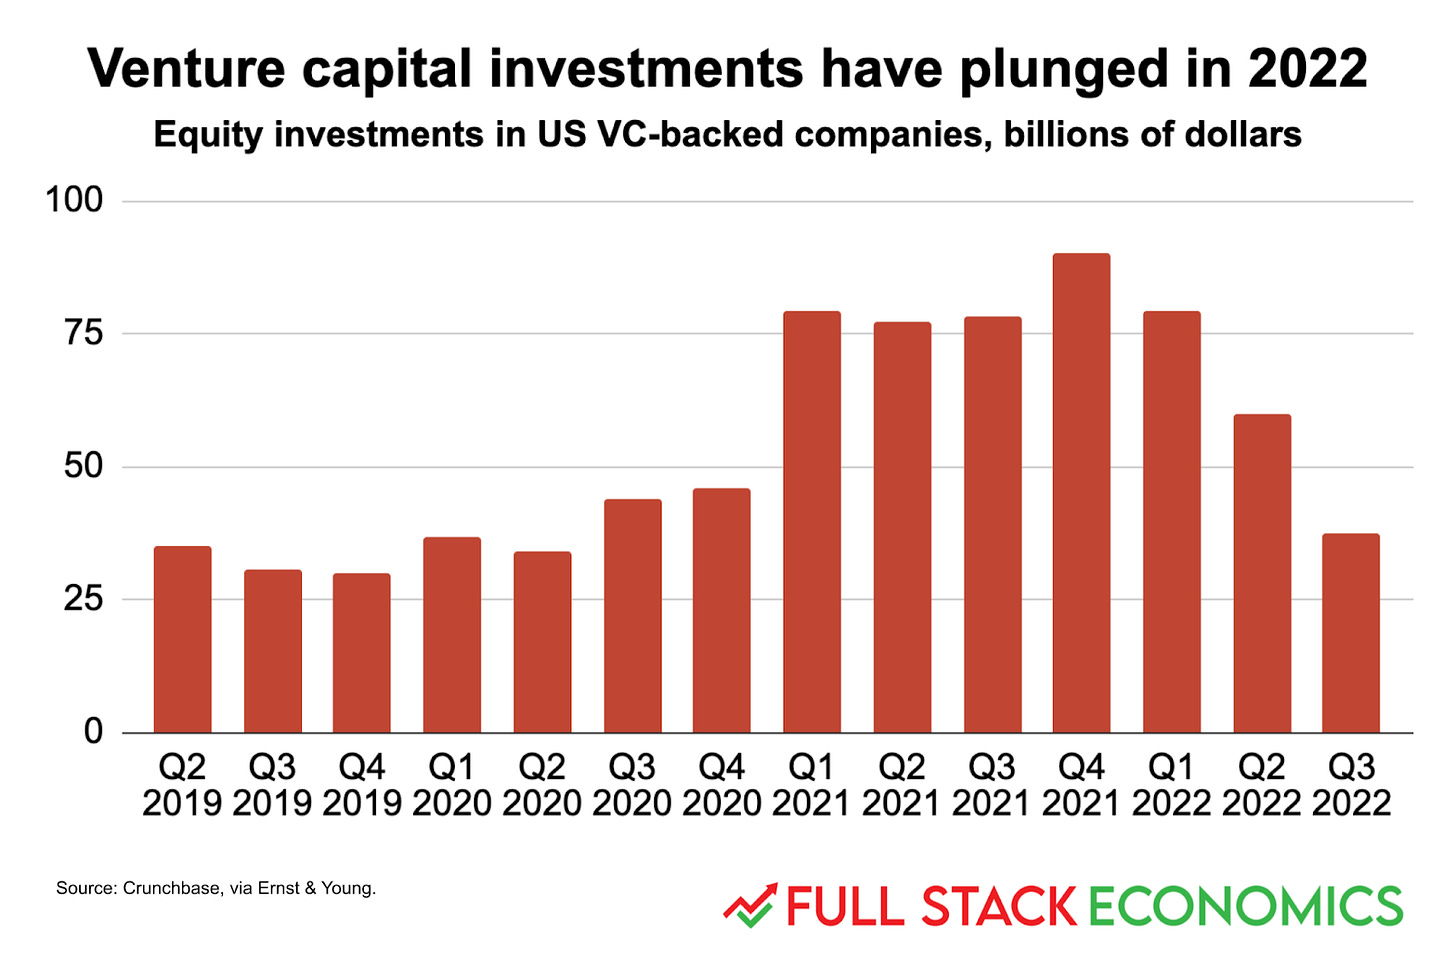
8. Venture capital funds are shutting their checkbooks
One group of people that is definitely cutting back their spending is venture capitalists. In 2021, US startups raised a record $325 billion in venture capital funding, according to an analysis by Earnst and Young. They started 2022 strong, with $80 billion raised in the first quarter. By the third quarter this had fallen to $38 billion, still a bit higher than the pre-COVID average but way below the 2021 peak.
This isn’t surprising—indeed, it’s a key part of how a Fed tightening campaign is supposed to work. When interest rates rise, investors become less willing to make risky investments, and so less money flows into venture capital. That, in turn, means there are fewer startups renting office space, hiring workers, and doing other things that contribute to higher inflation.
The downside, of course, is that one of the startups that doesn’t get funded could be the next Google or Tesla.
9. Housing construction is still pretty strong
Homebuilders began construction on 1.4 million new homes in October. That was a slowdown from the pace earlier in 2022, but it was still a faster pace of building than occurred in the last few years before the COVID pandemic. And even this cycle’s peak in early 2022 is far short of the all-time record building pace we achieved in 2006.
New homes are another sector of the economy that tend to be highly sensitive to interest rates, since almost everyone needs a mortgage to buy a home. So I’m surprised that home construction hasn’t declined more in the face of rising mortgage rates. The average interest rate on a 30-year mortgage rose from 3.5 percent in January 2022 to 5.5 percent in June and almost 7 percent in October. Yet housing starts declined only modestly, from 1.67 million in January to 1.58 million in June and 1.43 million in October.
That’s obviously not great, but I would have expected the doubling of mortgage rates to have a bigger impact. The big question for the Fed is whether the decline so far is the start of a longer-term trend like the housing collapse that started in 2006, or if demand for new homes is so strong that customers will continue buying despite rising mortgage rates.


Do you have a more direct comparison between monthly rental costs versus mortgage payments? They are both housing, and while a mortgage rate is related to monthly cost, a doubling of interest rate there doesn't double the monthly cost. I'm wondering if rents are rising enough faster than mortgages that it's helping drive a shift towards ownership.
Mortgage rates seem a lot less locked in, so maybe people are less concerned by them. If rates go up, you keep your older, lower rate. If rates go down, you have the option to refinance at the new lower rate and take advantage of the drop.